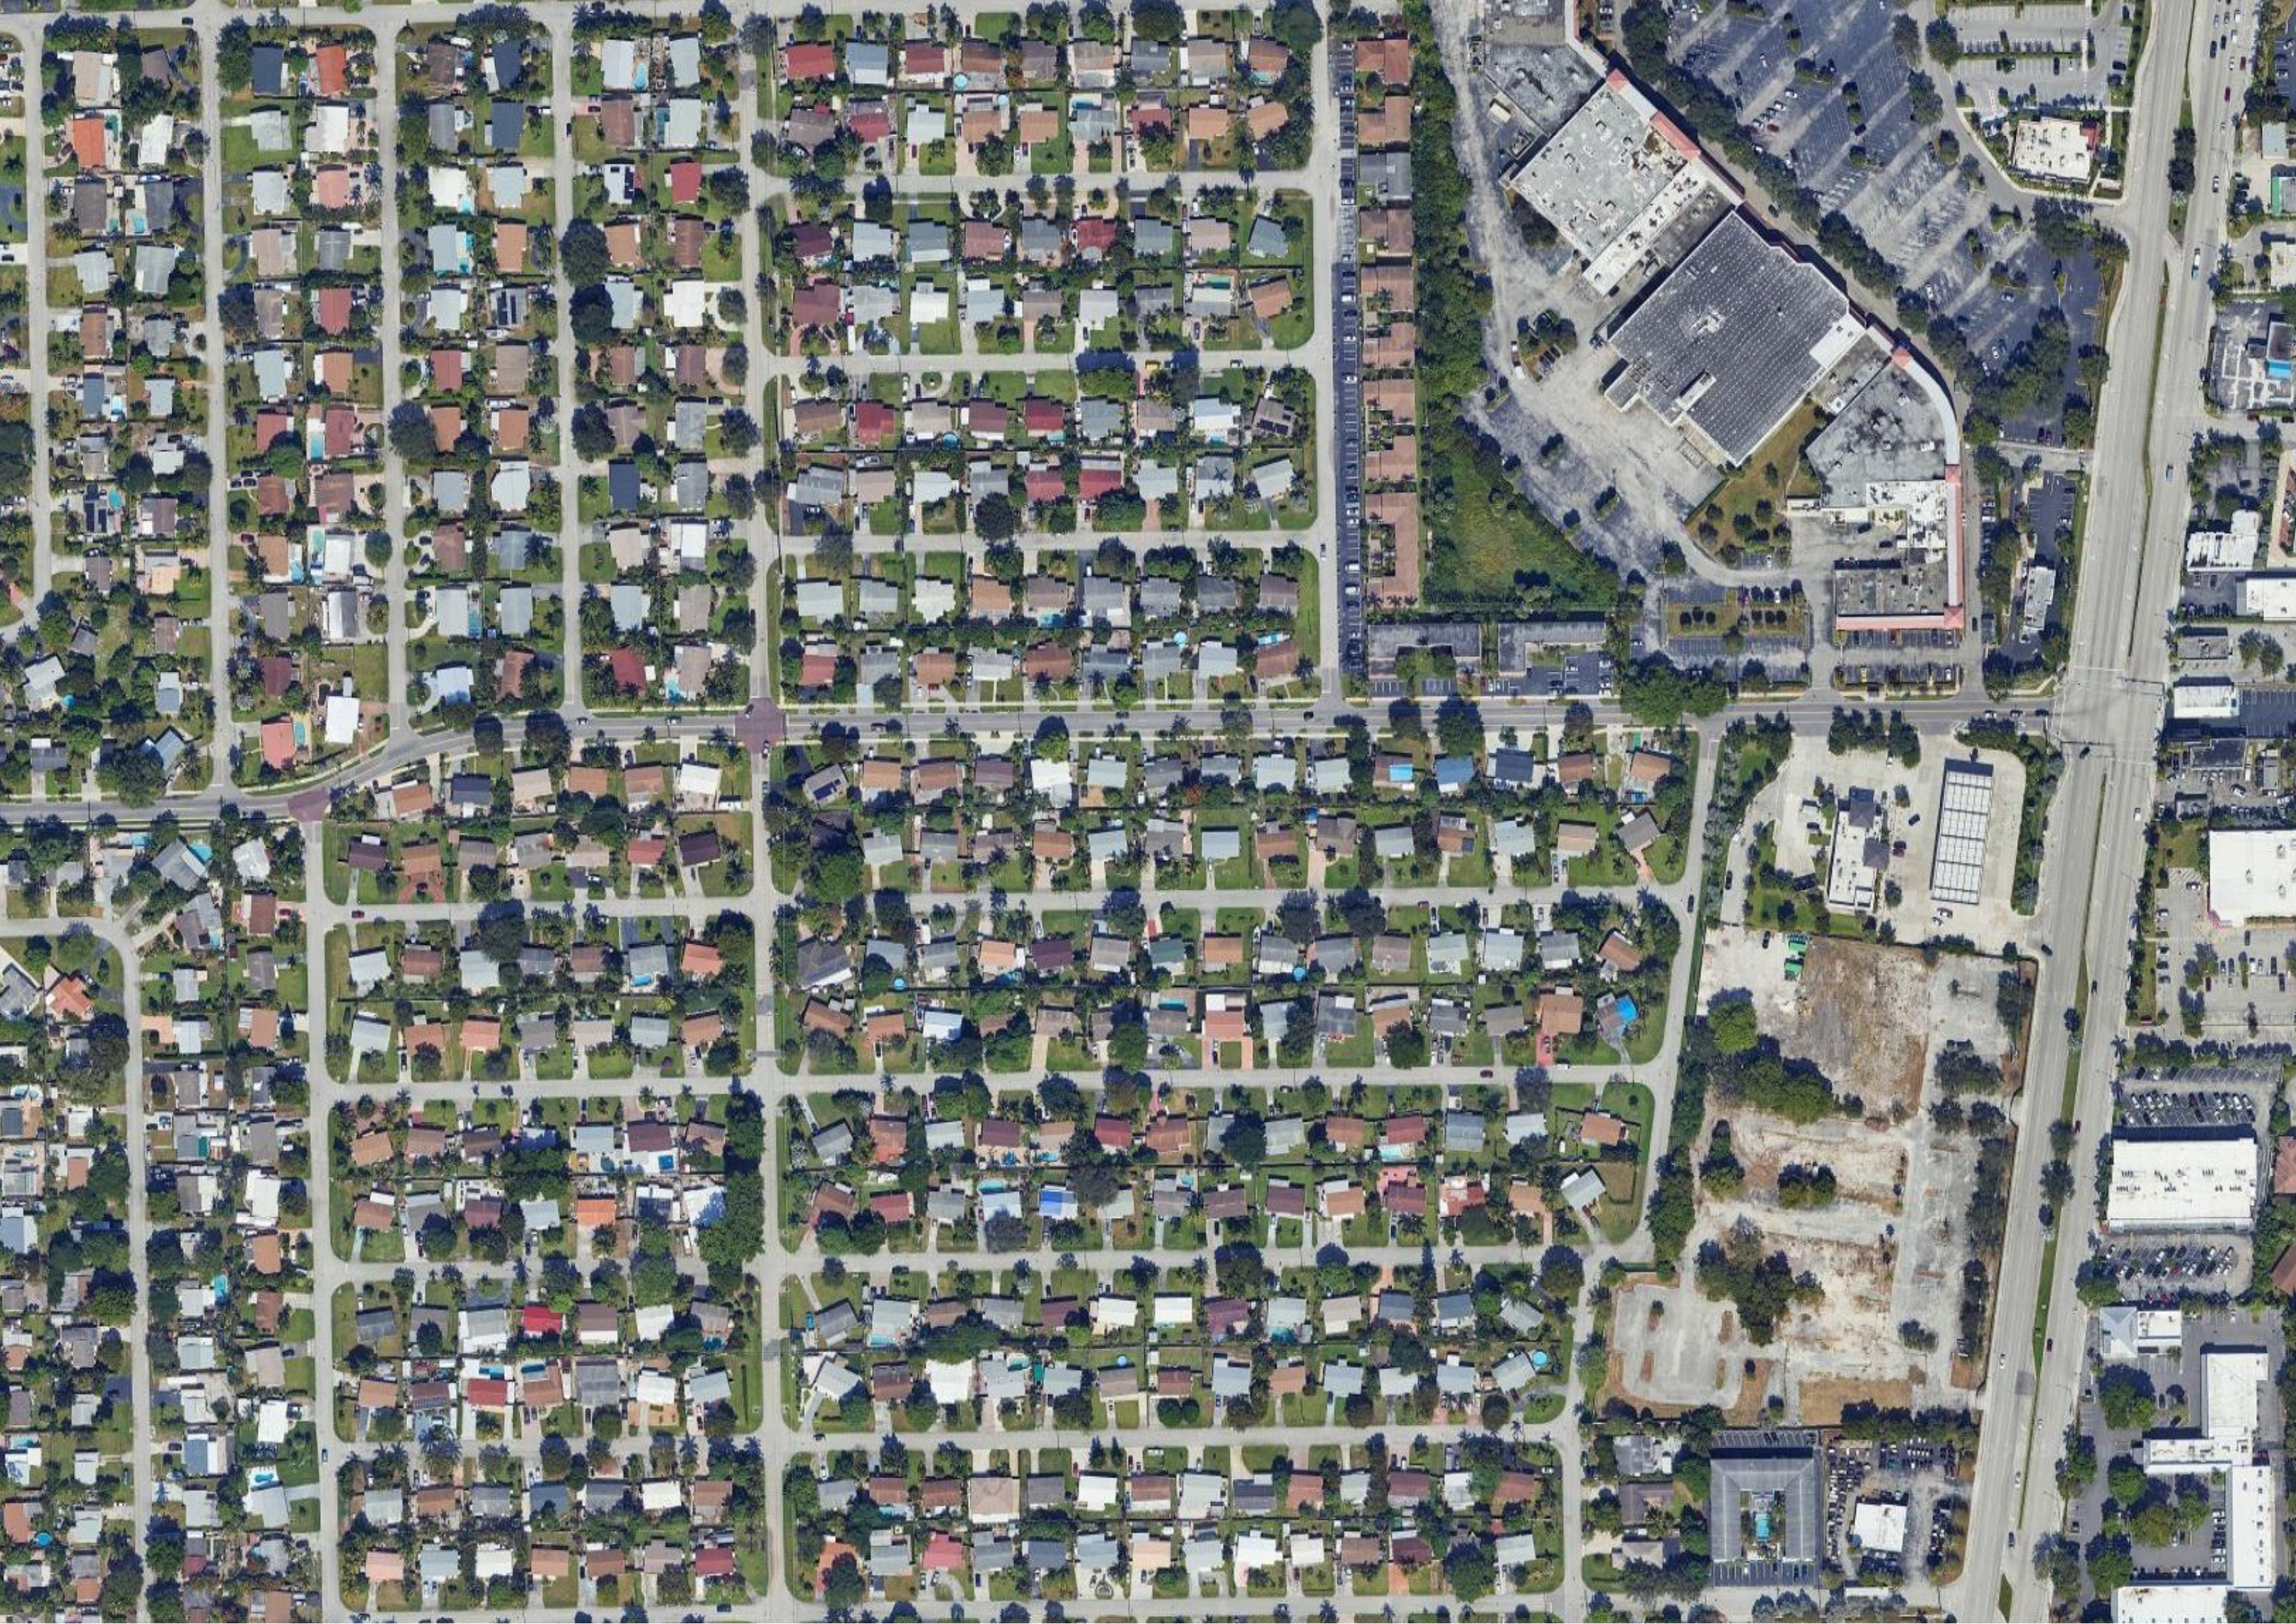
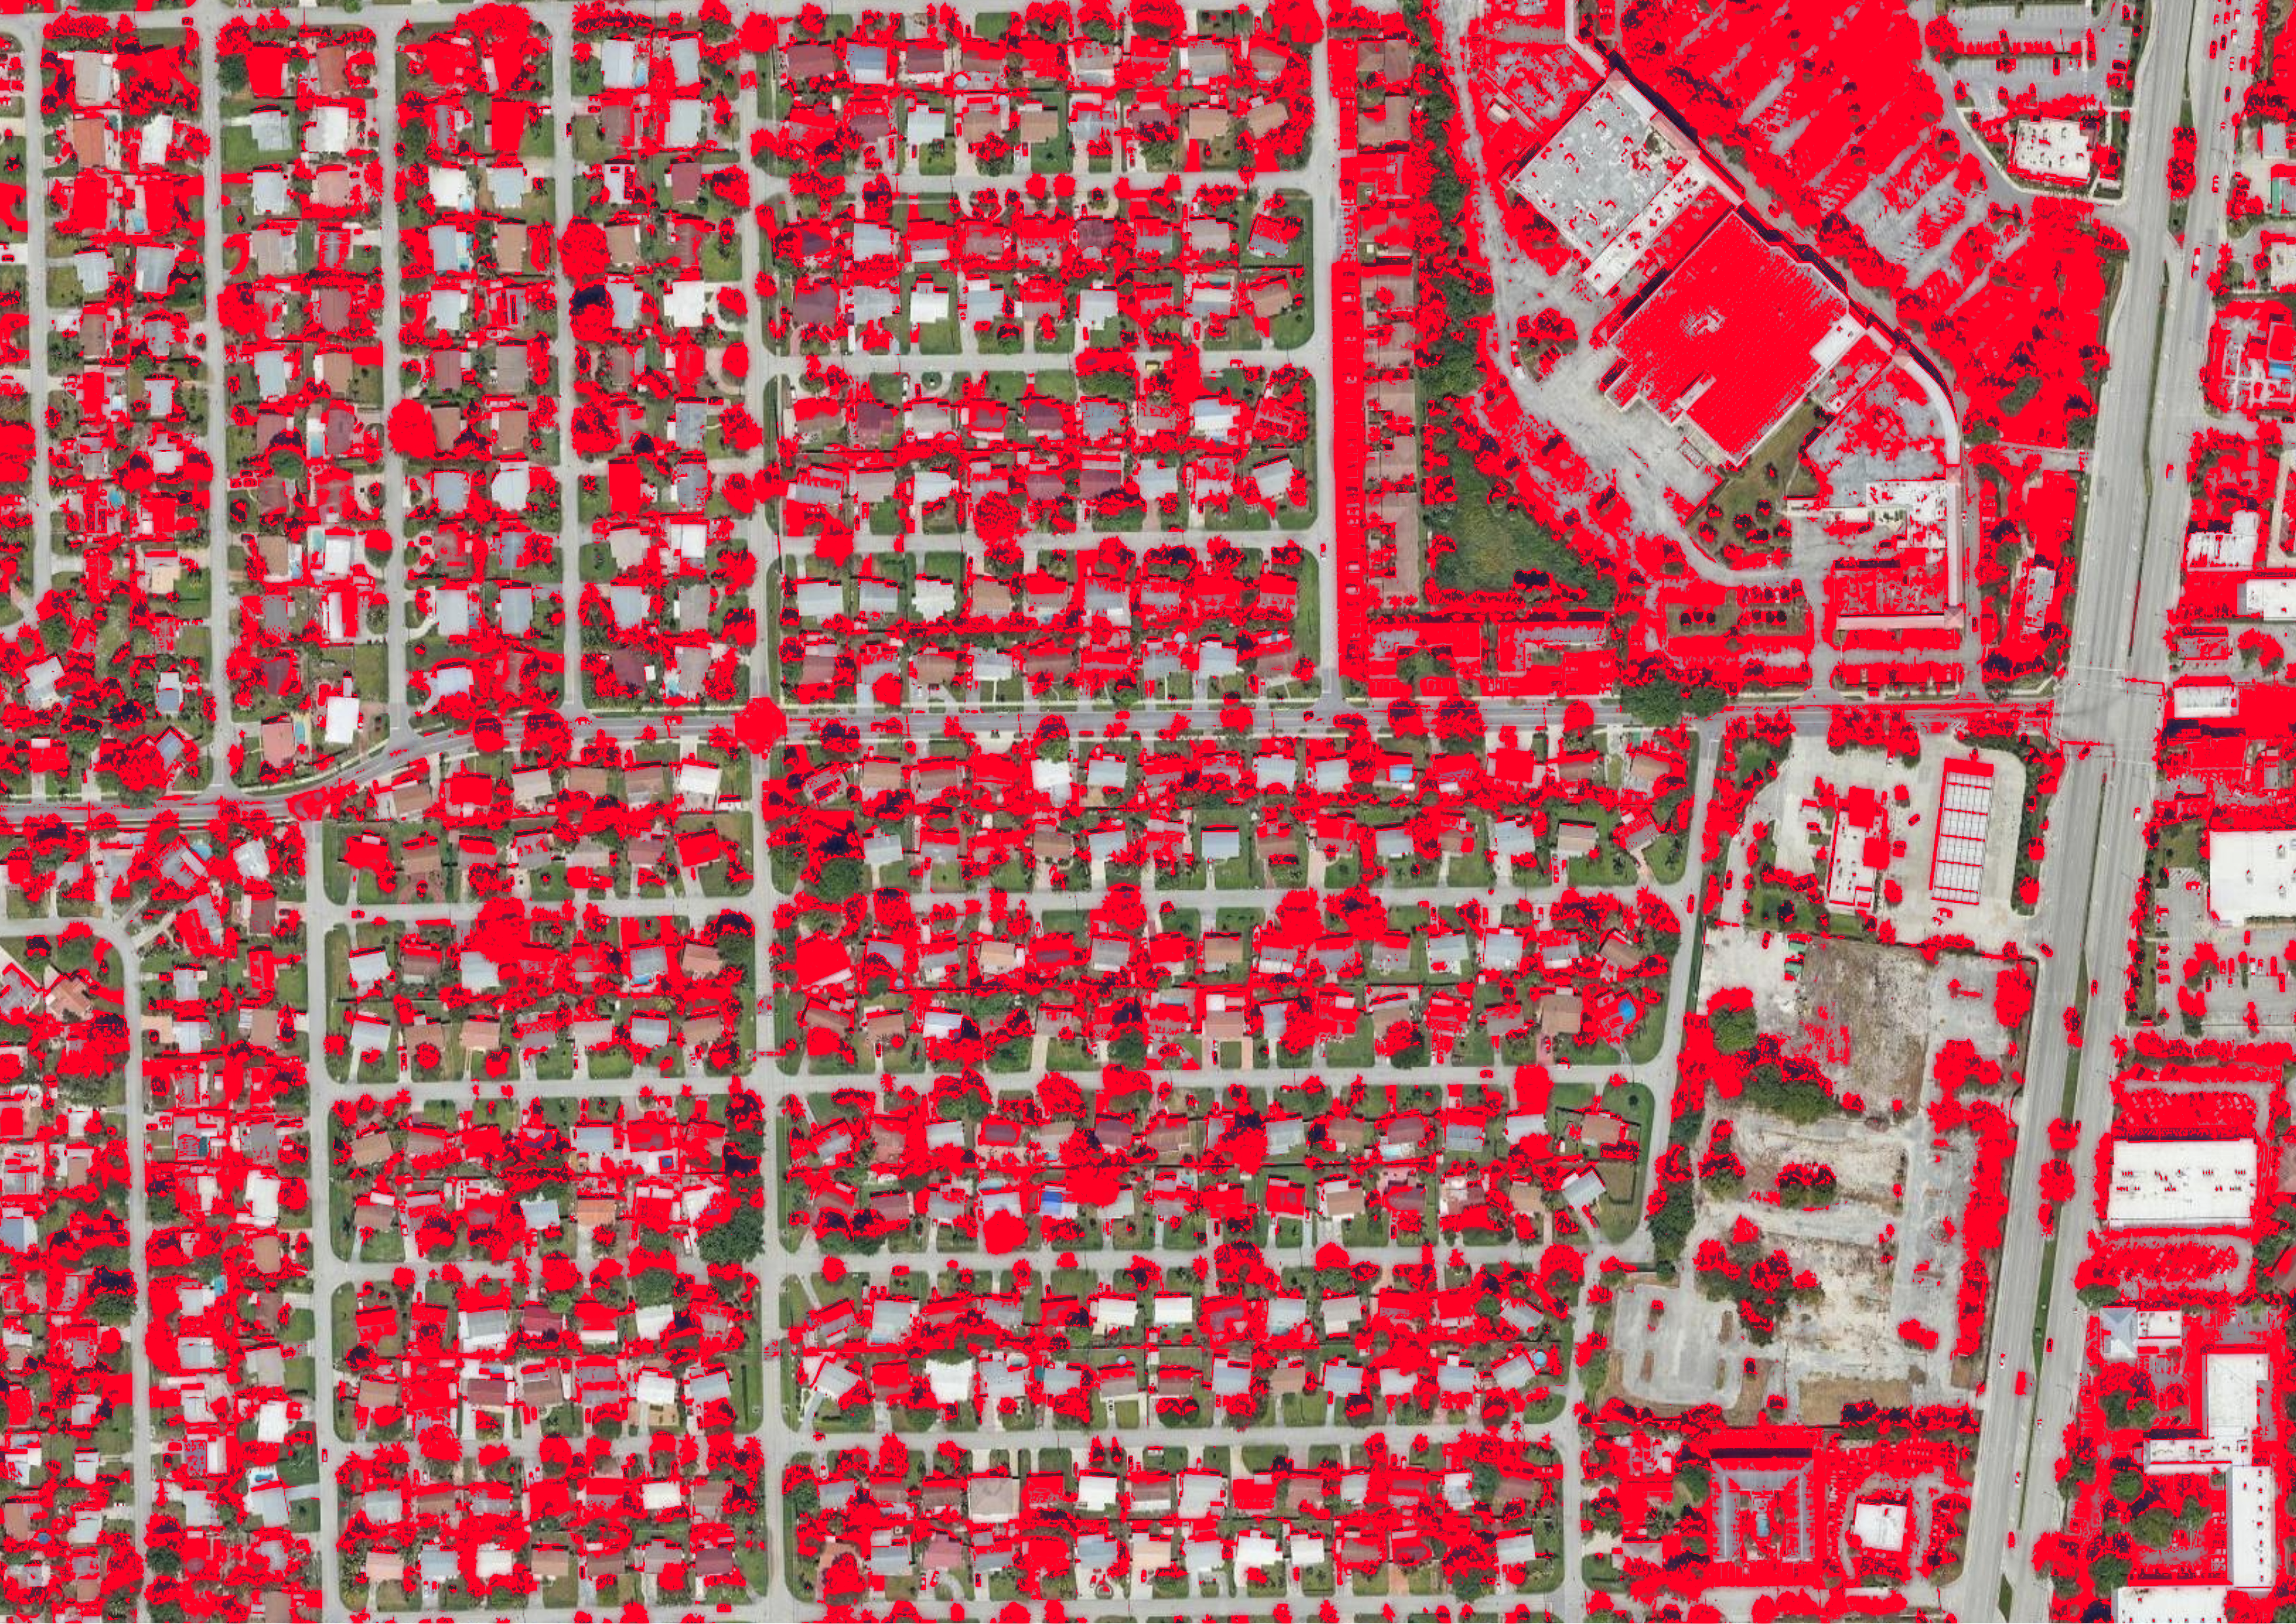
Urban Heat Island Mapping

This image uses machine learning algorithms including classification and anomaly detection to extract temperature patterns from satellite imagery. It shows how surface heat varies across the city, highlighting urban heat islands.

Base Map
Overlay Map

Move Slider

Real-Time Temperature Analysis

Live temperature heatmap showing urban heat island patterns across Manhattan. Hover over any census tract to see the temperature for that area.

Status: Initializing...
Data Source: OpenWeatherMap API
Update: Every 10 minutes
Interaction: Hover for temperature

Map Layers